Run your shop with real-time numbers
Revenue, margin, average basket, orders: Genuka turns every sale into a clear dashboard. Understand your business at a glance and decide without waiting for month-end.
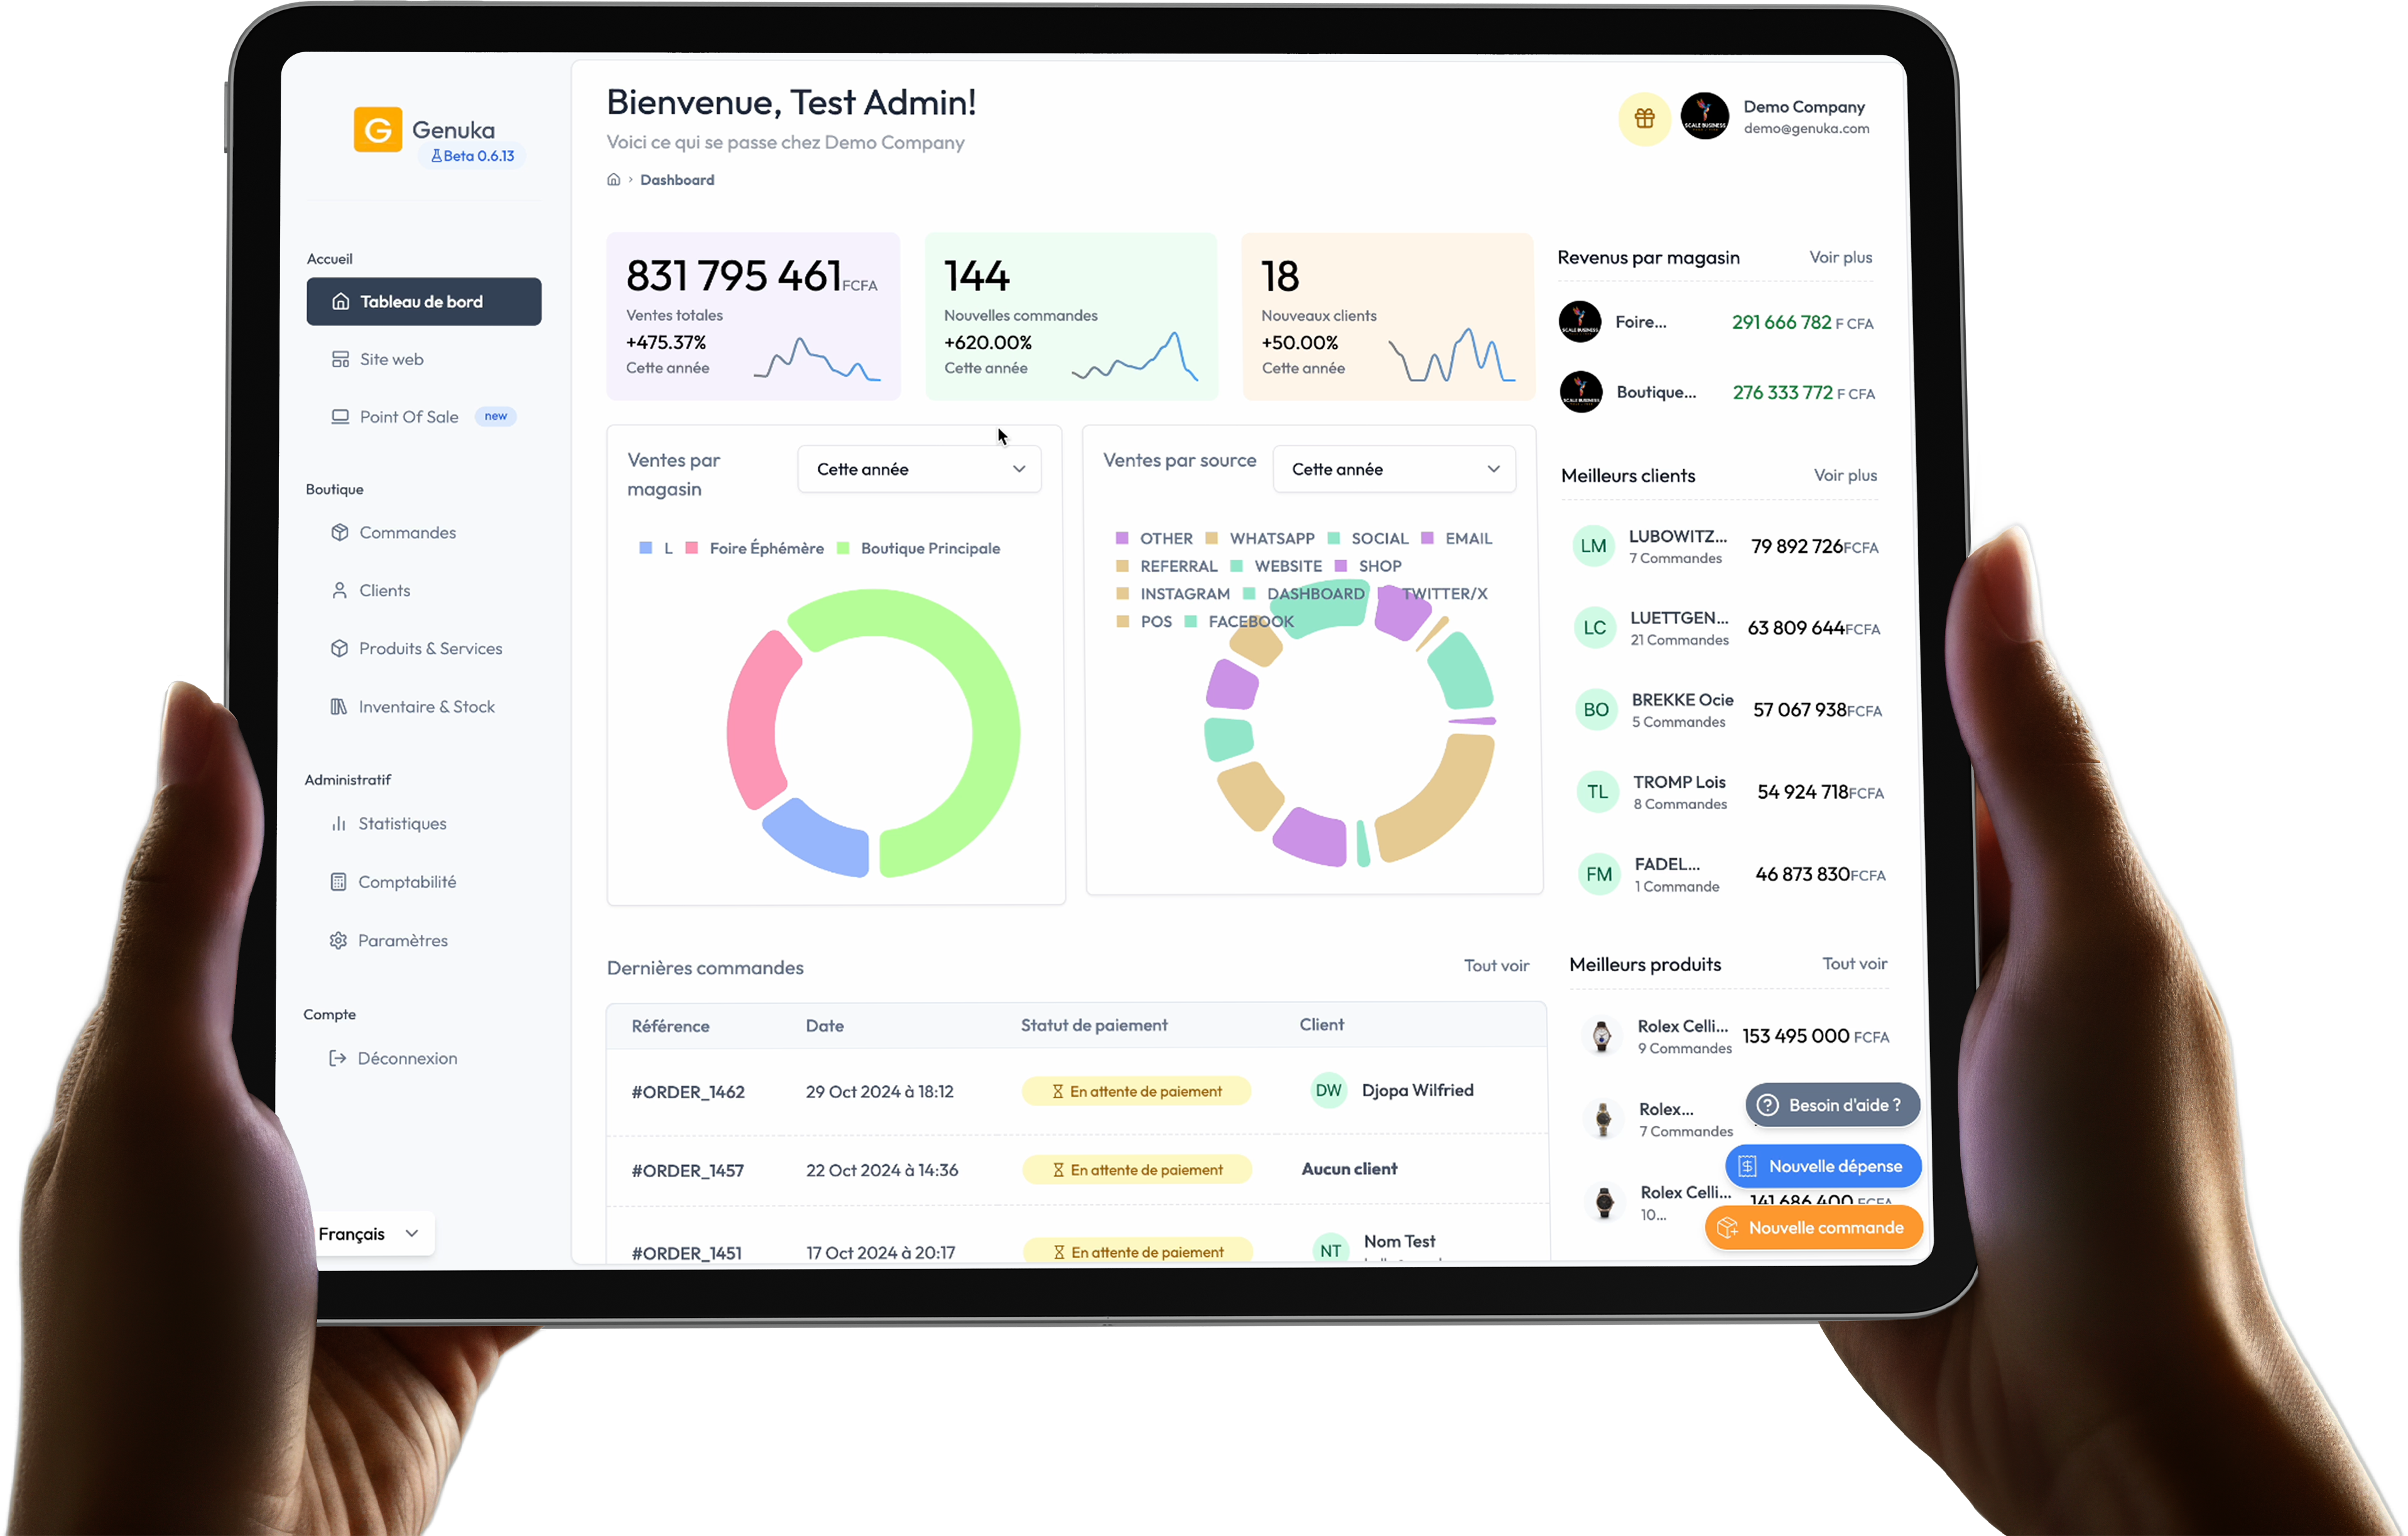
Your numbers, clear and always up to date
Everything you need to grasp your business at a glance and decide fast: key indicators, period comparisons and rankings of what earns you the most.
A living dashboard that updates with every sale. Revenue, margin, average basket and orders: your key figures show at a glance, with your sales trend line. You always know where you stand without opening a single spreadsheet.
Compare this month to the last one, this week to the previous, or two seasons side by side. Genuka computes the change as a percentage and colors it green or red, so you instantly spot what's growing and what's slipping.
Your best products, your most loyal customers, your most profitable stores: Genuka ranks them for you. Focus your effort and your stock where the money truly comes in.
Decisions driven by your real numbers
Stop running on instinct. Genuka gives you the exact picture of your business, continuously.
Your numbers, live
Every sale feeds your indicators in real time. No export, no waiting: your dashboard is always up to date.
Decide with data
Margin, average basket, trends: you see what works and what stalls, and adjust prices, stock and promos with full insight.
Export in one click
Need a report for your accountant, your bank or a partner? Export your data to Excel or PDF in one click.
From revenue to decision, in 3 steps
You sell, Genuka measures and guides you. All you have to do is act.
Sell as usual
POS, online orders, stores: every sale is recorded and your data is collected automatically.
Read your dashboards
Open Analytics and find your key indicators, trends and period comparisons, already computed.
Decide and act
Spot your star products and your weak points, then adjust prices, stock and campaigns to sell more.
“Before, I discovered my results at month-end. Now I see live which styles sell best and I restock before running out. My revenue climbed without changing anything else.”
Your questions about analytics
Your business deserves to grow.
Give it the tools.
Join 4000+ entrepreneurs who sell more and steer their growth in real time with Genuka.
7 days to try everything, no commitment. The only risk: finding out how much you were losing before.